Difference between revisions of "Jiyeh"
m |
Wikimaster (Talk | contribs) |
||
| (9 intermediate revisions by one other user not shown) | |||
| Line 43: | Line 43: | ||
Details and examples of the sonification methods used. | Details and examples of the sonification methods used. | ||
| − | + | Satellite Images: (courtesy DLR, Center for Satellite Based Crisis Information and NASA) | |
[[Image:20060716_g.jpg]] | [[Image:20060716_g.jpg]] | ||
| − | + | July 15 2006 | |
[[Image:2-719.jpg]] | [[Image:2-719.jpg]] | ||
| − | + | July 19 2006 | |
| − | [[Image: | + | [[Image:20060723_g.jpg]] |
July 23 2006 | July 23 2006 | ||
| + | |||
| + | [[Image:20060801_g.jpg]] | ||
| + | August 1 2006 | ||
| + | |||
| + | [[Image:804.jpg]] | ||
| + | August 4 2006 | ||
Sonification methods: | Sonification methods: | ||
Since the oil dissemenated in a generally northern direction, image scans were done from south to north (by flipping the image). | Since the oil dissemenated in a generally northern direction, image scans were done from south to north (by flipping the image). | ||
| − | |||
| − | + | Woon Seung Yeo's raster scan synthesis method of image sonification ( http://ccrma.stanford.edu/~woony/works/raster )provided the core sound materials for the piece. | |
| + | |||
| + | Raster scann synthesis is described in our DAFX paper: http://www.dafx.ca/proceedings/papers/p_309.pdf. | ||
| + | |||
| + | |||
| + | The satellite images were processed and denoised in order to focus on the edges of the coast and of the spill. Examples: | ||
| + | [http://ccrma.stanford.edu/~brg/j1.wav] - July 19 | ||
| + | [http://ccrma.stanford.edu/~brg/j2.wav] - July 23 | ||
| + | [http://ccrma.stanford.edu/~brg/j3.wav] - August 1 | ||
| + | [http://ccrma.stanford.edu/~brg/j4.wav] - August 8 | ||
| + | |||
| + | These sounds were processed using filter settings, temporal stretching and other signal processing methods in which the parameters were all set by measurements of the spill contour in relation to the coastline. | ||
| − | |||
The width of the spill at each sampled location is sonified by setting filter bandwidth (measured south to north each 25 pixels) at each sample position. | The width of the spill at each sampled location is sonified by setting filter bandwidth (measured south to north each 25 pixels) at each sample position. | ||
Coastal shape as well as the western edges of the spill in each image. are mapped to melodic pitch. | Coastal shape as well as the western edges of the spill in each image. are mapped to melodic pitch. | ||
| − | + | ||
| + | Considerable 'artistic license' was then enjpyed. | ||
| Line 77: | Line 93: | ||
http://creativecommons.org/images/public/somerights20.png | http://creativecommons.org/images/public/somerights20.png | ||
This work is licensed under a Creative Commons Attribution-NonCommercial-NoDerivs 2.5 License and ASCAP | This work is licensed under a Creative Commons Attribution-NonCommercial-NoDerivs 2.5 License and ASCAP | ||
| + | |||
| + | |||
| + | [[Category:Projects]] | ||
Latest revision as of 09:02, 2 October 2007
Jiyeh (2006) for computer generated and processed sound first performance: A Concert of Music on Ecology and the Environment, CCRMA, November 9 2006 at the Imaging Environment conference, Stanford University http://shc.stanford.edu/events/ImagingEnvSchedule.htm
Program notes: Jiyeh (2006)
Jonathan Berger
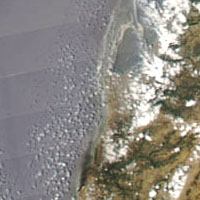
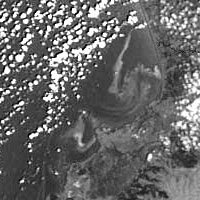
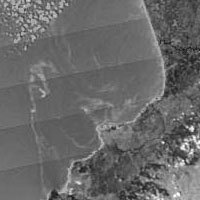
Jiyeh is a small coastal town in Lebanon built upon the ancient city of Porphyreon, reputed to be the site where a giant fish delivered Jonah to the shore. On July 14th 2006 a coastal power station in Jiyeh was attacked in an Israeli air strike causing over 20,000 tons of oil to spill into the Mediterranean Sea. Although there has been relatively little information regarding the ecological impact of this massive spill a series of sattelite photos show the dispersion pattern of the oil. These patterns appear as Baroque-like ornaments that distort the contour of the Lebanese coast line.
I was in Jerusalem in July 2006 and read a fleeting and innocuous news report regarding an oil spill on the Lebanese coast apparently caused by an air or ship based missile attack on an aging power plant in Jiyeh. Little information was forthcoming although the estimates of the amount of oil spilled were alarming. In September I asked Jeff Koseff if he had any information about the spill. He replied that, to his knowledge, there were only sattelite photographs and that those were yet to be carefully analyzed. Tonight's work, the first of a set of two pieces (this for multi- channel playback and a second for solo violin, percussion and string orchestra), uses data from the sattelite photographs to set parameters for synthesis and processing of sounds, as well as creating source audio material using a raster scan direct synthesis method bing developed by my PhD student Woon Seung Yeo. The music represents the evolution of the ornate oil patterns visible in the sattelite images to evoke auditory display of this disaster.
Jonathan Berger is a composer and researcher at CCRMA. His compositions include chamber, symphonic and vocal music as well as works incorporating digital synthesis and processing. His research includes developing methods and tools for effective auditory display of complex data. Berger's recent recording of chamber music for strings will be released this Spring by Naxos recordings on their American Masters series. Background:
Details and examples of the sonification methods used.
Satellite Images: (courtesy DLR, Center for Satellite Based Crisis Information and NASA)
Sonification methods:
Since the oil dissemenated in a generally northern direction, image scans were done from south to north (by flipping the image).
Woon Seung Yeo's raster scan synthesis method of image sonification ( http://ccrma.stanford.edu/~woony/works/raster )provided the core sound materials for the piece.
Raster scann synthesis is described in our DAFX paper: http://www.dafx.ca/proceedings/papers/p_309.pdf.
The satellite images were processed and denoised in order to focus on the edges of the coast and of the spill. Examples:
[1] - July 19
[2] - July 23
[3] - August 1
[4] - August 8
These sounds were processed using filter settings, temporal stretching and other signal processing methods in which the parameters were all set by measurements of the spill contour in relation to the coastline.
The width of the spill at each sampled location is sonified by setting filter bandwidth (measured south to north each 25 pixels) at each sample position. Coastal shape as well as the western edges of the spill in each image. are mapped to melodic pitch.
Considerable 'artistic license' was then enjpyed.
Stereo mix-down of 8-channel piece: (beware: it's large!).
http://ccrma.stanford.edu/~brg/jiyeh-stereo.aif
Please note this audio file is not for public presentation and may not be copied or distributed.
http://creativecommons.org/images/public/somerights20.png
This work is licensed under a Creative Commons Attribution-NonCommercial-NoDerivs 2.5 License and ASCAP


